![]()
Opigno LMS User manual
Consult statistics
- Axel Minck
- SimonContreras
As an administrator or global statistics manager, or student manager for a training, or class manager (see User roles), you can consult statistics about users' results and the way your Opigno platform is used.
According to your profile, the statistics pages will be filtered to display only the trainings or classes you are allowed to manage. Administrators, global user managers and statistics managers can see the entire statistics dashboards.
To access statistics dashboards, just click on the statistics item in the Main menu: 
Statistics are available at three different levels:
Global dashboard
Global dashboard offers a global overview of the way your Opigno instance is used.
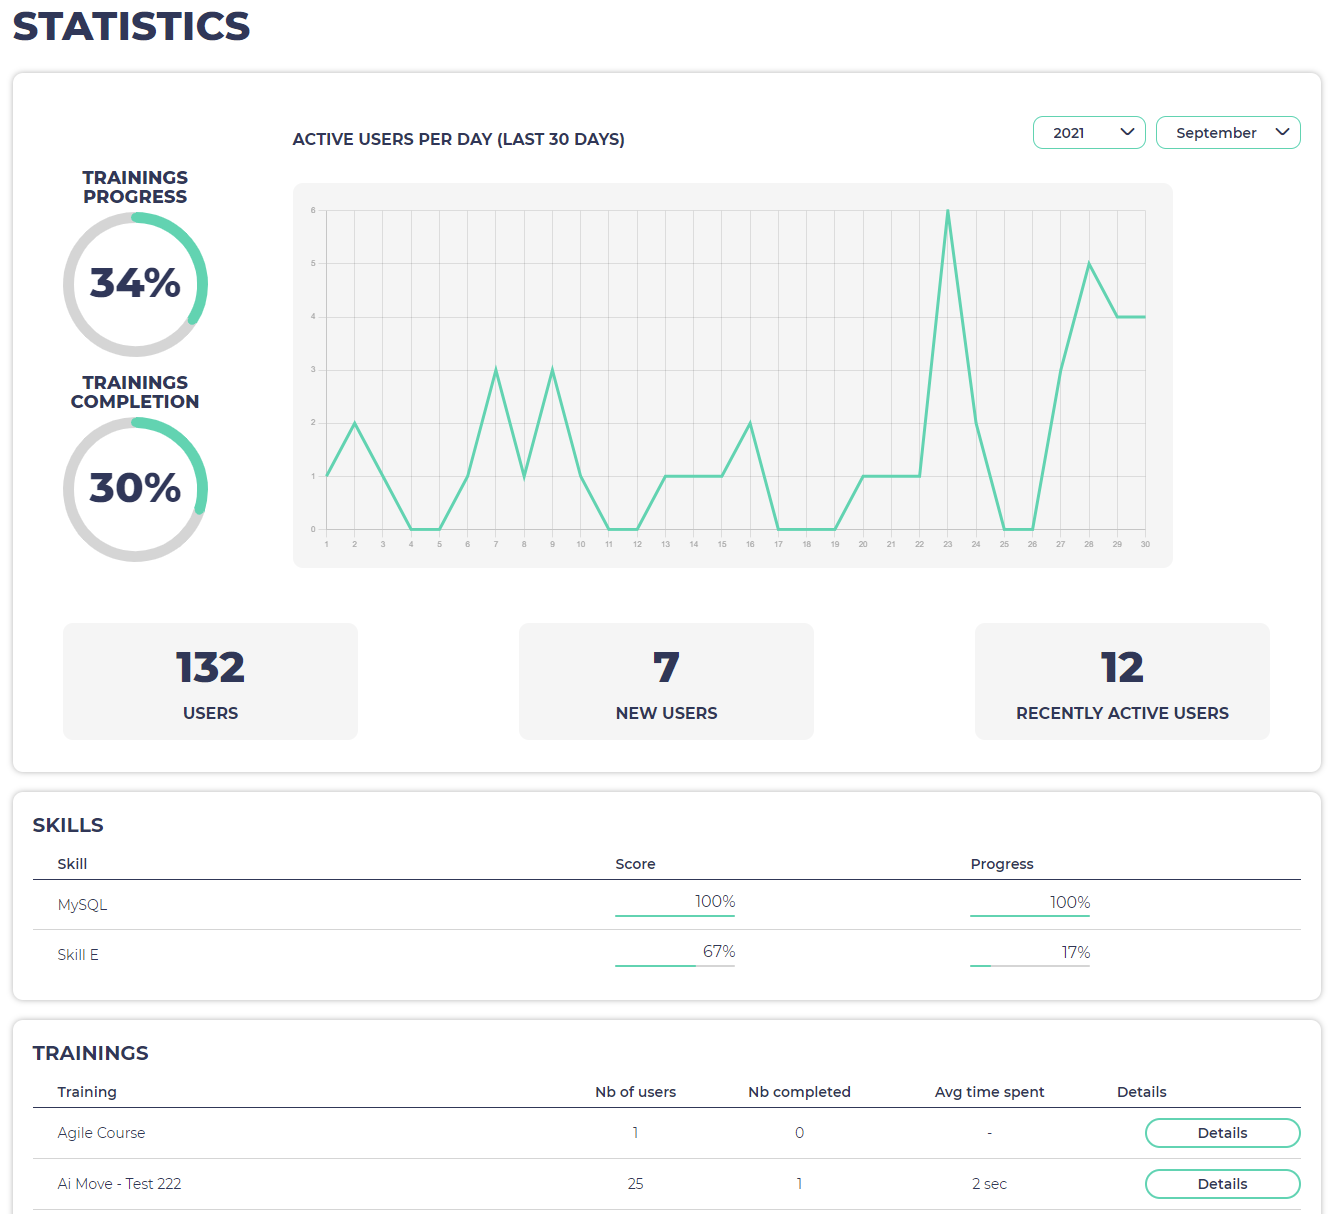
You will find on this interface:
- the global training progress:
It is calculated as the sum of training progress for all published trainings divided by the total number of published trainings.
The training progress for a training being the sum of progress for all the users registered to the training divided by the number of users registered to the training.
- the global training completion:
It is calculated as the sum of training completion rate for all published trainings divided by the total number of published trainings.
The training completion for a training being the total number of users being successful at the training divided by the number of users registered to the training.
- a chart presenting the number of active users per day: this is the number of unique user login during each day
- the total number of users
- the number of new users, that are the users who registered to the platform less than 7 days ago
- the number of recently active users, that are the users who logged in to your Opigno instance during the 7 last days
- the list of trainings on your Opigno instance, with for each of them:
- the number of registered users
- the number of users who completed the training
- the average time spent by users within the training
- a link to go to the statistics dashboard for the training (see below the "Training dashboard" section for more details)
The date filters on top apply to the chart with active users per day and to the training progress and training completion charts. The selected date range applies as follows:
- for the chart with number of active users per day, it will restrict the chart to the selected period
- for the chart with training completion, it will display the ratio completion / registration calculated during the selected period
- for the chart with training progress, it will display the average progress among users having worked on the training during the selected period
Training dashboard
The training dashboard present statistics specific for a training.
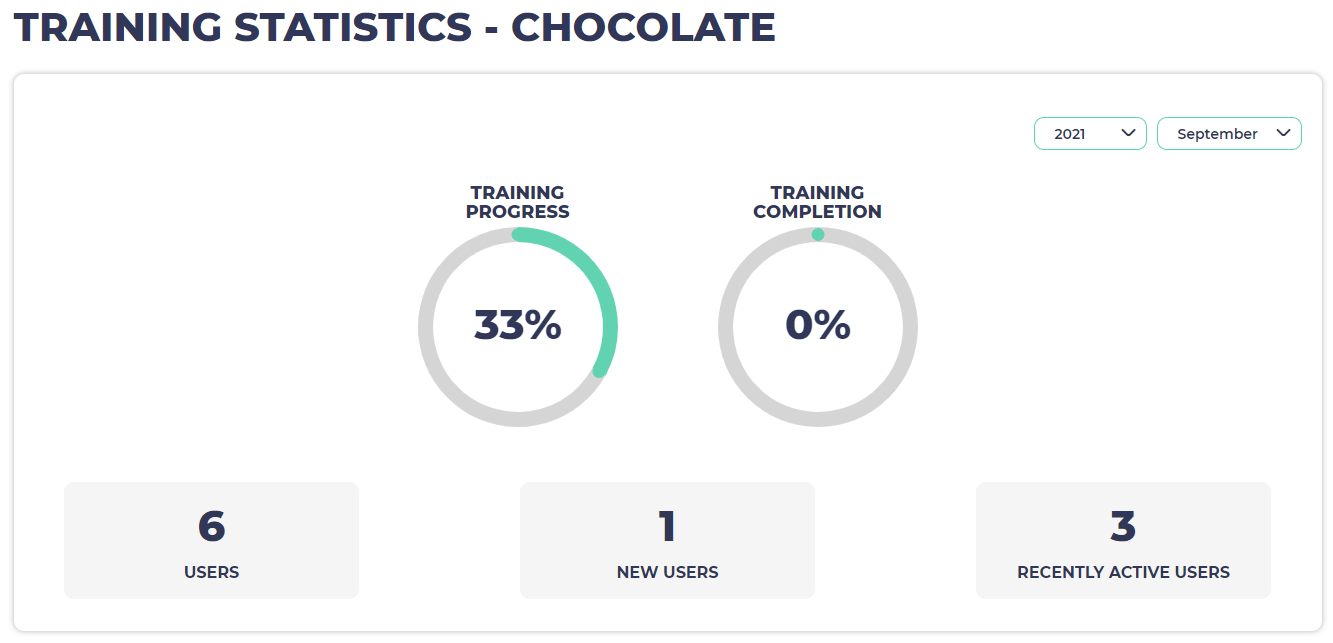
You will find on this interface:
- the training progress: the sum of progress for all the users registered to the training divided by the number of users registered to the training
- the training completion: the total number of users being successful at the training divided by the number of users registered to the training
- the number of users registered to the training
- the number of new users registered to the training within the last 7 days
- the number of recently active users who visited contents inside that training within the last 7 days
The date filters on top apply to the chart with training progress and training completion charts. The selected date range applies as above for general statistics but with restriction to this training.
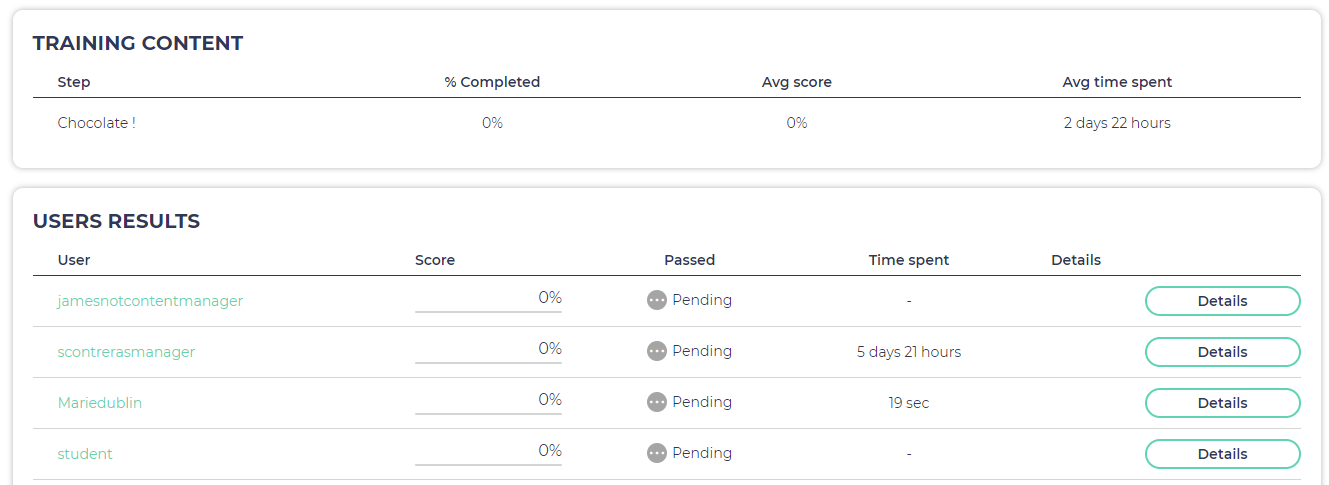
- the training content (all the steps inside the training) with for each of them
- the % completed (number of user having completed this content divided by the total number of users registered to the training)
- the average score
- the average time spent
- the users results with for each of them
- the score
- the status (passed, pending, expired or failed)
- the time spent
- a link to get more details *
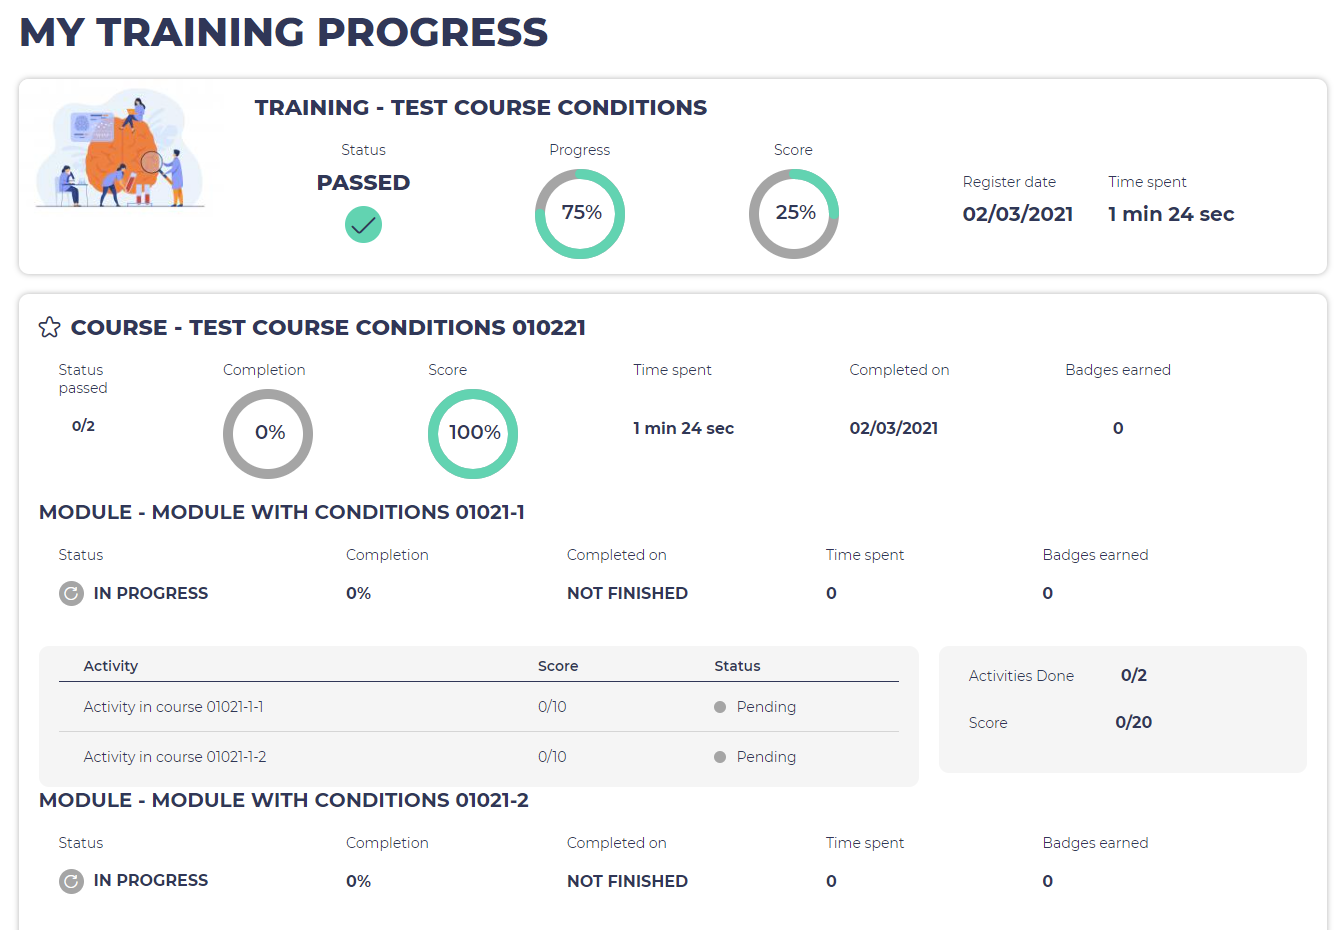
*. When clicking on the details link, a block with further details related to the user's achievements for that training will expand:
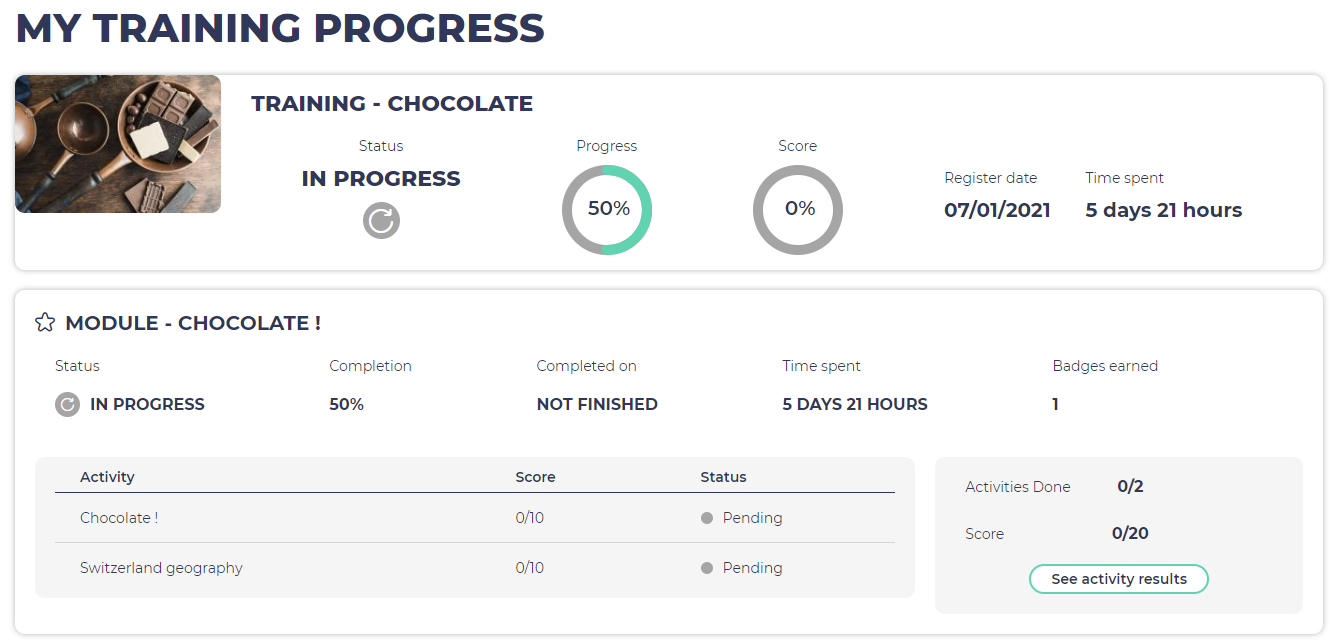
You can see:
- the number of modules passed vs the total number of modules
- the percentage of completion (number of modules done divided by the total number of modules in the training)
- the average score for the training
- the time spent
- the completion date
- the list of modules in the training, with score and status, as well as a button to get some further details
- the list of activities in the related module, how many are completed and the scores.
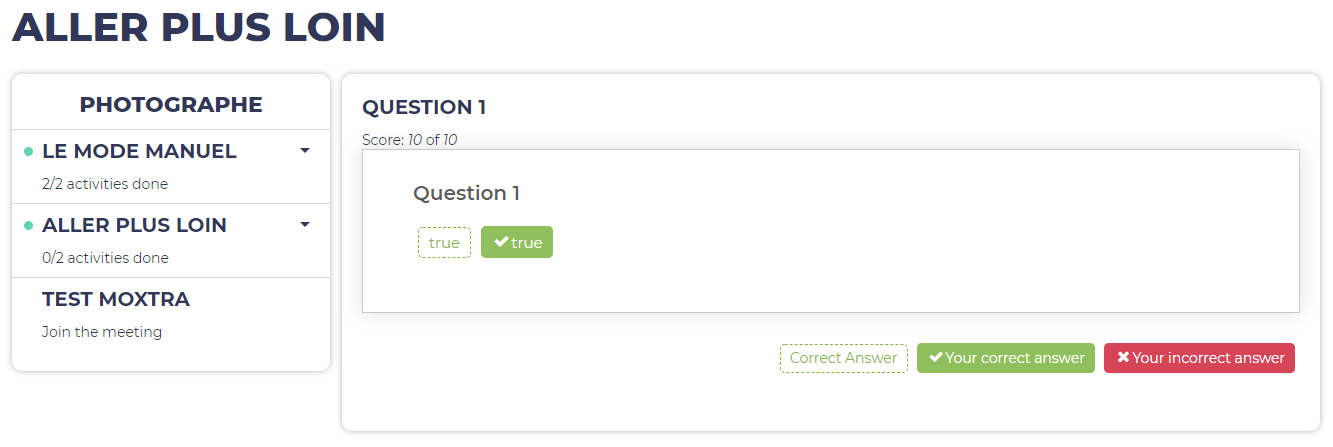
Clicking on details will then lead to the module's summary page, with the user's answers vs correct answers, and score.
Note: the score for the training only considers mandatory modules, and is calculated as the average of score for all these modules. For mandatory modules containing no activity with max score >0 (meaning that total max score for the module is 0) Opigno considers that score for the module is 100% (once module is completed).
The score for a module is calculated considering only activities whose max score is different from 0. It's the weighted average for all such activities considering max score.
Learner dashboard
The learner dashboard presents some information about the learner, as well as his achievements.
It is available for the learner, for administrators, global user managers and statistics managers, as well as the local user managers at training level and class coaches (with restriction to the training they are in charge of).
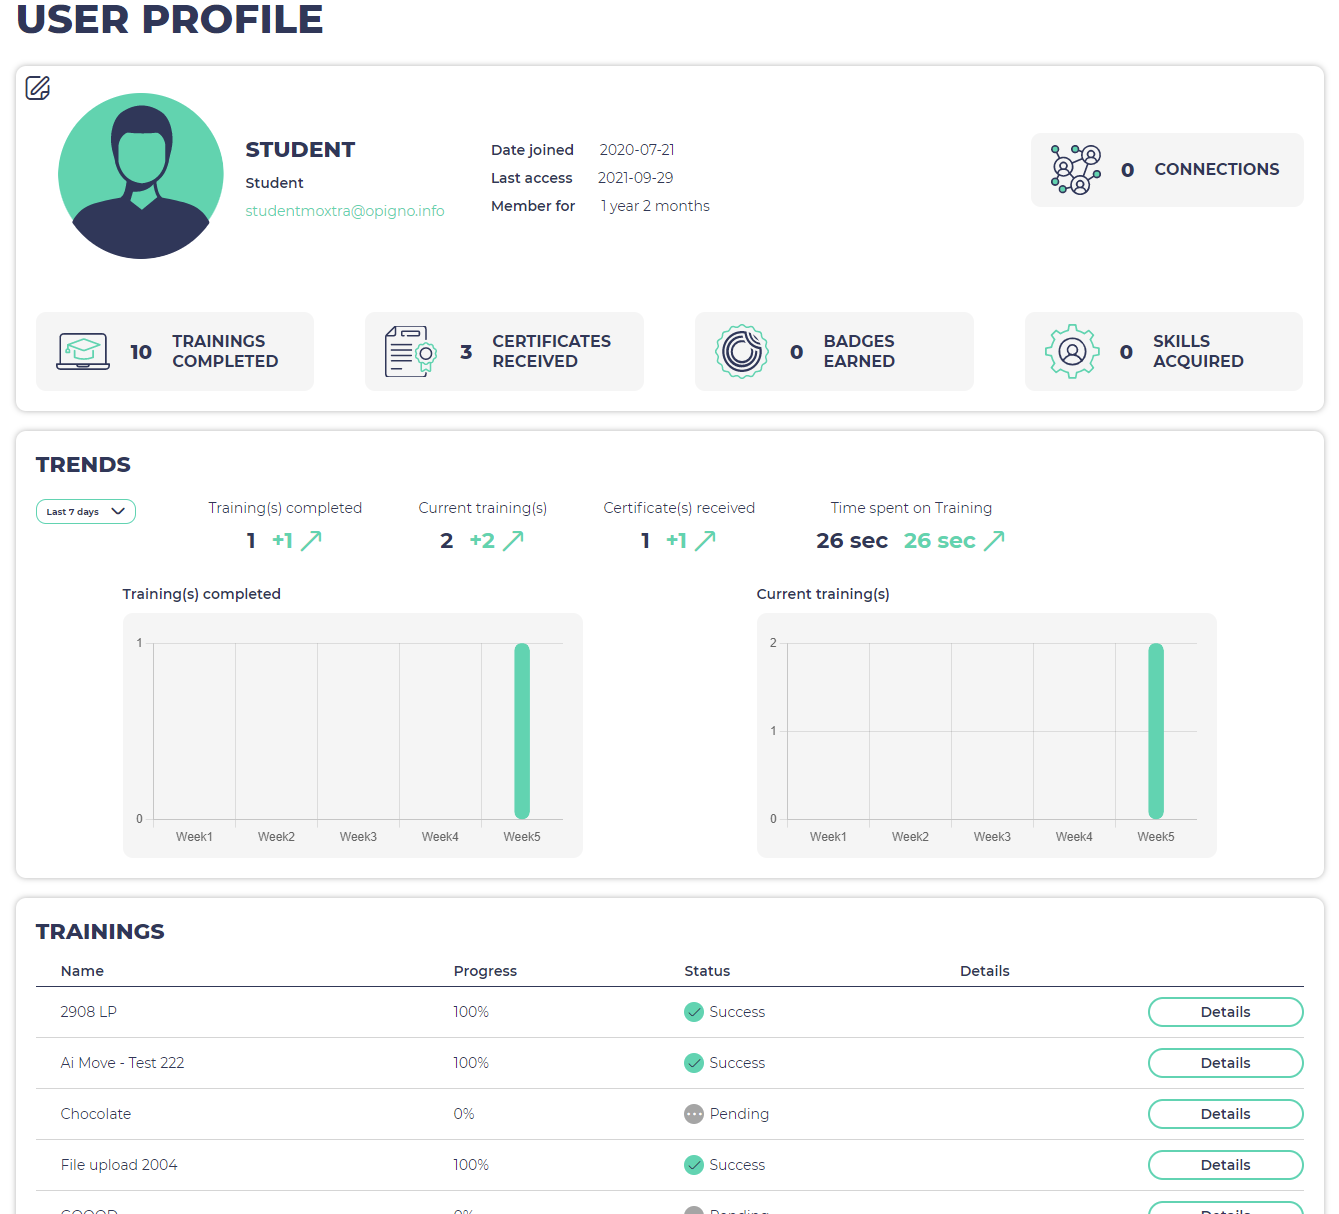
The interface displays:
- some user information
- the number of connections
- the trainings completed
- the certificates received
- the badges earned by the user
- the skills acquired
- the trends
- the list of trainings the user is registered, with for each of them
- the score
- the status
- the time spent
- a link to get additional details
When clicking on the details link, a block with further details related to the user's achievements for that training will expand:
You can see:
- the number of modules passed vs the total number of modules
- the percentage of completion (number of modules done divided by the total number of modules in the training)
- the average score for the training
- the time spent
- the completion date
- the list of modules in the training, with score and status, as well as a button to get some further details
- the list of activities in the related module, how many are completed and the scores.
Clicking on details will then lead to the module's summary page, with the user's answers vs correct answers, and score.
Class statistics
Class statistics are available from the class management interface, by going to the class management interface (learn more at Managing classes) and clicking on the name of the class for which you want to consult statistics.
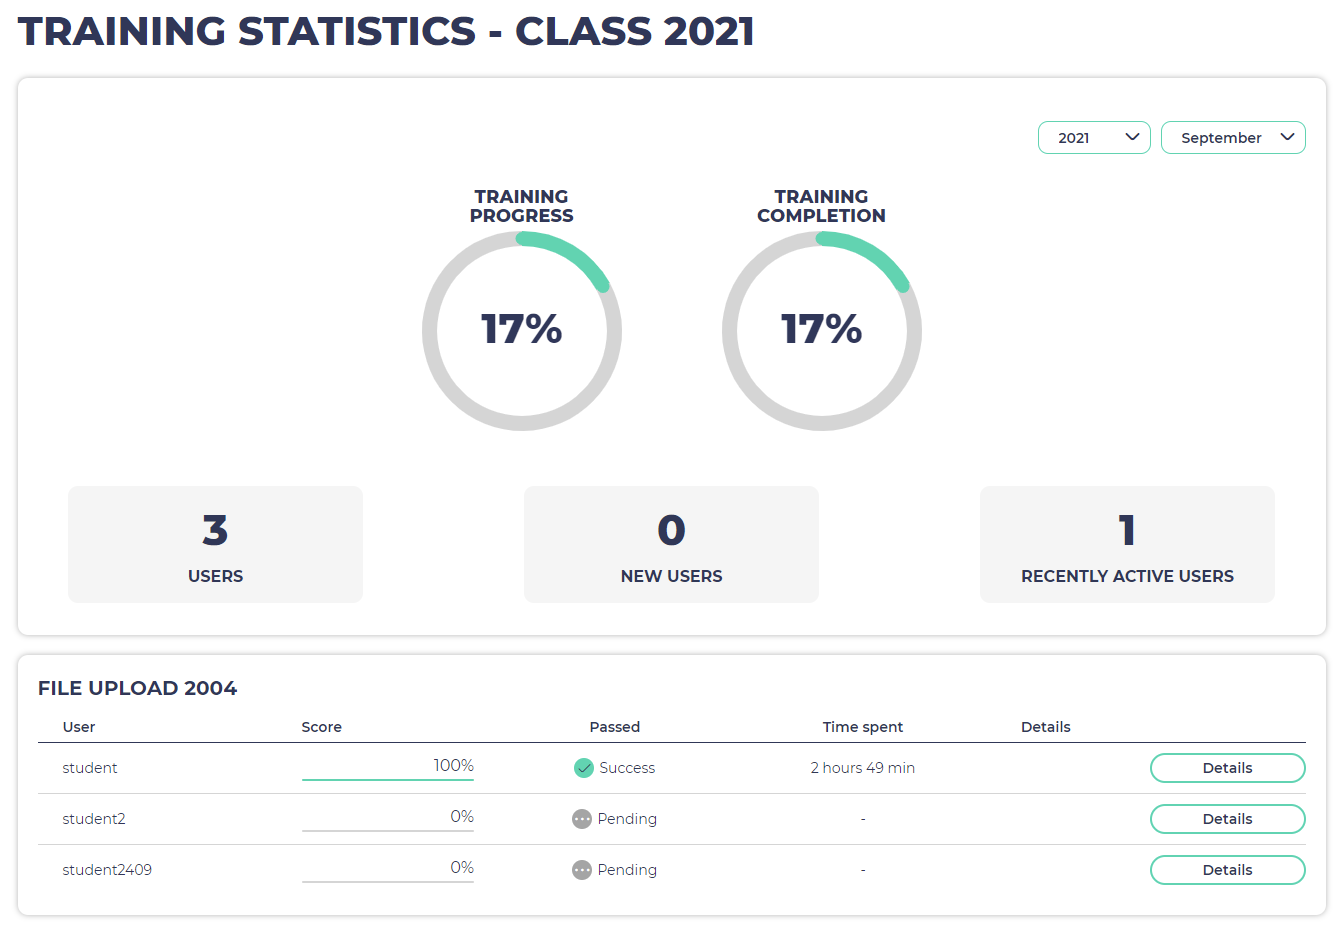
The metrics are very similar to the ones explained above for the global dashboards, except they are calculated by considering only the users of that class and the trainings where the class is registered.
Classes have to be directly registered to the related trainings (users from the class should not be directly registered to the trainings, but through the intermediate of the class).
It displays the global training progress and completion, as well as for each training where the class is registered the result of each user of the class.
Related content
Copyright 2008-2024 Connect-i. All Rights Reserved - https://www.opigno.org