![]()
Opigno LMS User manual
Course and class statistics
- Opigno LMS
This interface displays some statistics related to a course (or a class, in a similar way).
This interface is available for administrators and the teachers in charge of the course.
It is reachable from the general statistics page by clicking on "View statistics" links for a given course, or by clicking inside a course on the following pictogram in the top right toolbar:

General overview
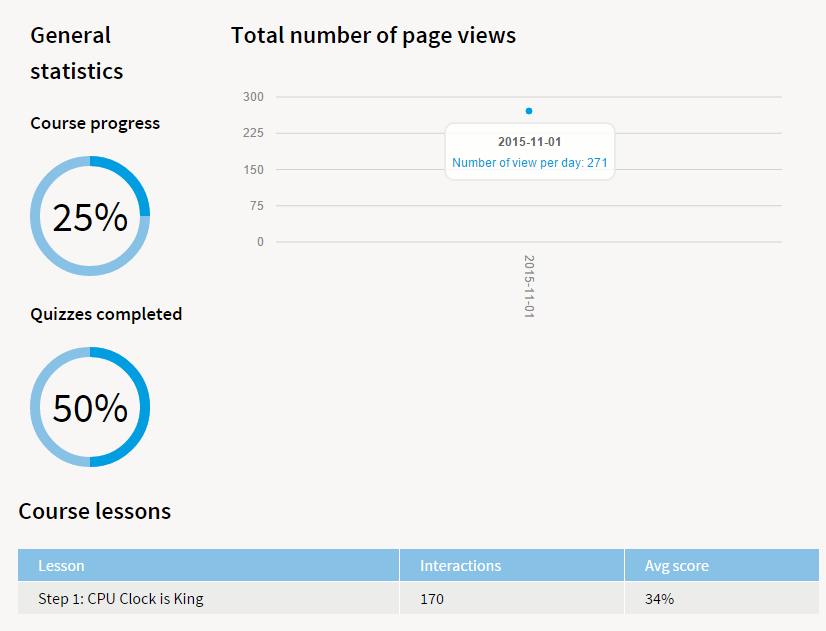
General statistics
Course progress
This is calculated as the total number of users having successfully finished the course, divided by the total number of users registered to the course.
Quizzes completed
This is calculated as the total number of finished and successful attempts on lessons or in-house trainings inside this course divided by the total number of finished attempts (successful or not) on lessons and in-house trainings inside this course. If a user takes several times the same quiz only his best result will be considered. The calculation consider the selected time period.
Total number of page views
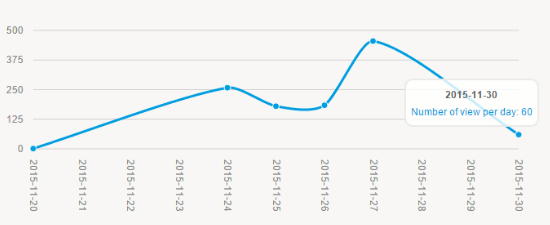
This displays the total number of page views inside the course by all the users registered to this course.
- If the current month is selected, the chart displays the number of page views for each day of the month.
- If another month is selected, then only the total number of page views for the month will be displayed.
- If no month is selected, the chart will display the total number of page views for each month of the year.
Course lessons
Interactions
Number of page views inside the course ; this makes possible to figure out the interest if users in a lesson.
Avg score
This is the average score for a lesson, calculated for all the users having finished the lesson (excluding the attempts that were stopped before the end of the lesson, and considering the best result of each user).
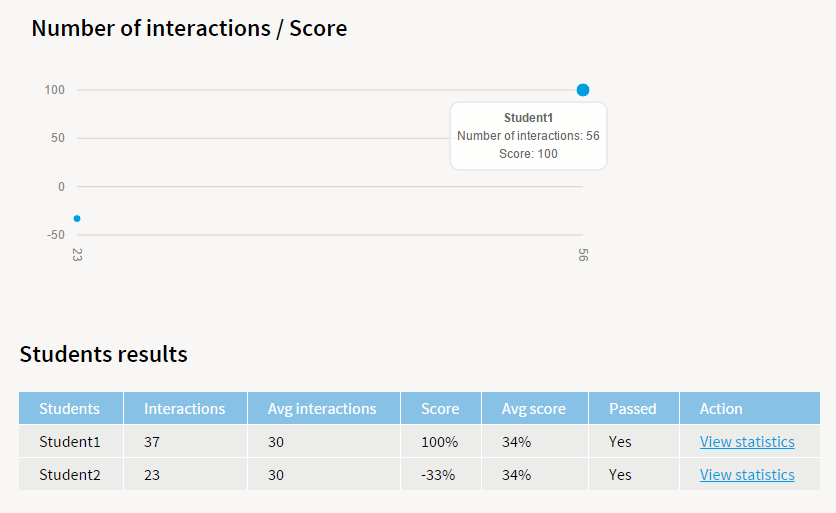
Number of interactions / Score
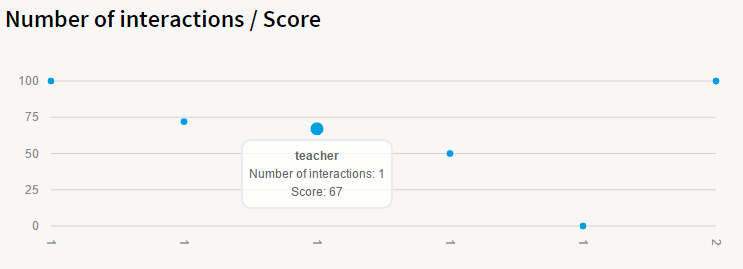
This chart displays both the scores and number of interactions for each user registered to the course.
Each user is a dot on the chart.
The number of interactions (total number of page views inside the course) illustrates the efforts and constancy of a user.
The score (average score considering all the lessons inside the course, excluding non-finished attempts ; for example if there are two lessons and that the user only did one with a 100% score, his global score will be 100%) illustrates the user's success.
Consequently, a user with a high number of interactions but a low score would be considered as having difficulties. To the opposite, a user with low number of interactions but a high score would be skilled and at ease.
Students results
This table displays a detailed overview of the users of a course, and their results.

Interactions
Number of page views (lessons, etc.) from the user inside the course.
Avg Interactions
This is calculated as the average number of interactions for all the users of the course ; this makes possible to compare the each user with the average.
Score
This is the average score for the user considering all the lessons inside the course (online lessons, in house trainings, etc.) and considering only the best result of the user for each lesson.
Avg score
This is the average value of the average scores for all users registered to the course ; this makes possible to compare each user's score to the average.
Passed
This indicated whether the user has successfully passed the course or not (the course is passed if the user has successfully finished all the required lessons).
By clicking on the link "View statistics" it's possible to get a detailed statistics page related to one given user.
Related content
Copyright 2008-2024 Connect-i. All Rights Reserved - https://www.opigno.org